 There have been some interesting responses to my previous post on Synod, representation and gender—thanks to all who provided corrections to the data for individual diocese, and filled the gaps. Two kinds of responses predominated in the conversation on Facebook, which became quite lively. They are encapsulated by the response of my colleague Amanda Digman on the blog:
The two major reasons I didn’t put my name forward were 1) I have children at home. I’m already away for diocesan conference and my annual retreat and usually something else comes up and I’m often out in the evenings or worse tea time (school governors meetings). I just think I want to wait until they have flown the nest (or since that may take a lot longer than in the past, don’t want me around all the time)! Also, if I remember correctly, one session is in a half term and our family holidays are precious. there may not be many more. The other reason (2) is that I don’t feel confident enough to stand up at a hustings and tell everyone why I’m the best candidate (because maybe I’m not!).
On the first question, childcare, there were a good number of supporting observations from people who felt the same. There was an important reminder not to stereotype—not all ordained women are married or have children—but making observations about a cohort of people is not the same thing as stereotyping. There was also some protest against the expectation that women should be the ones primarily responsible for childcare. But in fact the comments were not expressing expectation—they were documenting reality as it is practiced. Whether we think it is a good idea or not, the reality is that, where both partners in a marriage are in full-time employment or ministry, fathers find it easier to be away from childcare than mothers.
On the second question, confidence, there were also some strong comments. One person observed:
I think this gets at a core issue of women in positions of leadership across a lot of culture – women wait to be asked or are afraid they’ll be judged if they stand for leadership roles or need affirmation. I know that’s a generalisation but I see it A LOT in the young women I teach and mentor. The inner voice ‘am I good enough’ is something I’ve seen a lot of.
and another responded:
I think that’s exactly it, in fact I think I read some research somewhere about men and women applying for senior roles. when it comes to the ‘essential’ criteria on the job spec a man is more likely to apply even if he matches only a small number of the criteria but a woman on average, will only apply if she matches almost all.
There followed some powerful personal testimony about how the issue of confidence has affected this person as a woman. (I haven’t included names, since I have not asked permission to identify the individuals.) It is not surprising that the Church and Synod face the same kinds of issues that we see in wider society in relation to gender differences in representation.
But that is only half the story. Having asking the question, ‘Why are three times as many men as women clergy standing for Synod?’ I was taken back by one response on Twitter:
@Psephizo because there are three times as many men as women clergy? https://t.co/kcZfb3Pbsa
— sue penfold (@PenfoldSue) September 24, 2015
The reference is to the latest set of Statistics for Ministry which are from 2012. As Sue points out, it gives the numbers for clergy in different roles split by sex. Here are the headlines:
- Female clergy now account for 23% of full-time parochial clergy and 11% of senior clergy
- Stipendiary male clergy: 6,017 (77%)
- Stipendiary female clergy: 1,781 (23%)
- Self supporting male clergy: 1,488 (47%)
- Self-supporting female clergy: 1,660 (63%)
- Total male clergy: 7,505 (69%)
- Total female clergy: 3,441 (31%)
In other words, there are two and a half times as many male clergy overall as female—and four times as many stipendiary men as women. So having three times as many men standing as women might be an accurate, fair and proportionate reflection of overall clergy numbers.
What can we learn from this, and from the discussion about the numbers?
- It is interesting to me that only one person, in all the correspondence, pointed out that the numbers I had quoted needed to be put in a wider context. The thought had occurred to me at the time, and I had originally intended to make a comment to that effect, but I was so struck by the disparity that it slipped my mind. There is also another context to put this in, which is the relative representation in previous years.
- The reason why I had been so struck by the figures was the situation of my own diocese. We are about 50% women in ordained ministry, and I realised that I therefore spend a lot of my time relating to women clergy and in meetings where there is a fairly equal mix. It was therefore extremely odd to be in a room of candidates who were all male. Of course, it is not the case in every part of the church—as the numbers clearly demonstrate. But it was striking how much my response was shaped by my own context and experience. Whenever we reflect on these issues we need to be prepared to ‘do the math’ and check our own experience against it.
- Having said that, there are clearly some deeply felt issues, and I am glad that raising this question provided some space to air these views. We need to continue to take them seriously—and perhaps this ought to feed into the agenda of Synod itself.
- Alongside that, there are contrasting voices which we need to listen out for, and which are almost never heard—the voice of men who feel displaced by the call to represent women fairly. The bottom line is that, if Synod ends up being more female than the list of candidates is, then male clergy will be (proportionately) under-represented. How do we balance this against the need to encourage women to let their voices be heard in a Church which is undergoing transition?
- As a number of commentators pointed out, there is another whole question of representation that is waiting to be addressed—the presence of black and minority ethnic people on Synod and in wider Church leadership.
 The Statistics for Ministry are well worth perusing for other issues too. A couple that caught my eye related to the distribution of clergy and the age of training.
Table 4 shows the population per stipendiary clergy. It turns out that there are 10 dioceses (mostly rural) where there are roughly twice as many clergy per head of population compared with 7 other dioceses (which are mostly urban). Given that church attendance is higher in rural areas, and that most of our population is centred in the cities—and that, historically, Christianity grew as an urban movement—this raises some serious questions about strategy for overall clergy deployment.
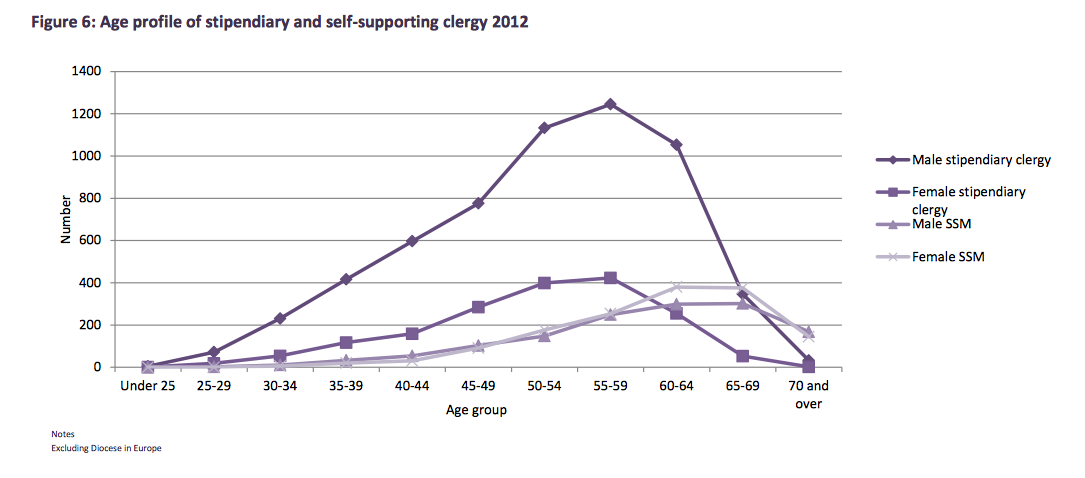
Table 6 (shown here) show the age profile of clergy, and the big bulge in the 55–59 age bracket is the cause of almost all our challenges in mission and ministry. And we are still not training people at the right age to correct this imbalance (Figure 20). So much more needs to be done in encouraging young vocations.
Follow me on Twitter @psephizo
Much of my work is done on a freelance basis. If you have valued this post, would you consider donating £1.20 a month to support the production of this blog?
 Buy me a Coffee


This may be a very stupid question, but why, in September 2015, are the most recent Statistics for Ministry from 2012?
2012 stats are collected 2013, so published in 2014, so 2015 may not have been published yet. Takes a while for the info to filter through into e.g. the Church of England handbook and Crockfords etc.