Marginally later than in some previous years, the full details of the annual returns on attendance for the Church of England has been published (‘Statistics for Mission’). This is in two parts, both linked here: a report, giving the main statistics and trends, helpfully illustrated with graphs; and the detailed breakdown by diocese in a series (not ‘serious’!) of spreadsheets. Both are worth looking at. Thanks as ever to Ken Eames in Church House for their production.
Preliminary figures were released in June, and I commented on them then. As Ken had predicted, the overall picture has not shifted; the early data is a reliable indicator of the full picture, but this report comes with more detailed analysis and reflection.
So, what is the headline? According to the press release on the Church of England website, it is:
Attendance at Church of England churches rises for the fourth year in a row
The overall number of regular worshippers across the Church of England’s congregations rose to 1.009 million in 2024, a rise of 0.6 per cent, according to the annual Statistics for Mission findings.
It was the second year in a row in which the Church of England’s “worshipping community” – the combined number of regular members of local congregations – has stood above a million since the Covid-19 pandemic.
All age average attendance on a Sunday also rose 1.5 per cent to 581,000 in 2024, extending rises over recent years.
And overall attendance across the week edged upwards by 1.6 cent in a year, and stood at just over 702,000 last year, according to the figures.
The increase was driven by a recovery in attendance by adults (over 16), among whom average Sunday attendance was up by 1.8 per cent and weekly attendance rose by 1.8 per cent.
I understand that one of the roles of Comms is to take the most positive angle on any story—but, as with the press release last year, the headline is deeply misleading. I sincerely hope we don’t have the same ecstatic claims from church leaders about ‘growing for the first time in 100 years’ or some such. That is all misleading—and is suggests that church leaders are in denial of reality. Unless you admit the problem, you cannot solve it.
This is the real headline: on nearly every measure, the figures are now back in line with the long term trend of general decline and ageing established before the COVID pandemic. You can see this from the details, but the most striking is the graph from p 14:
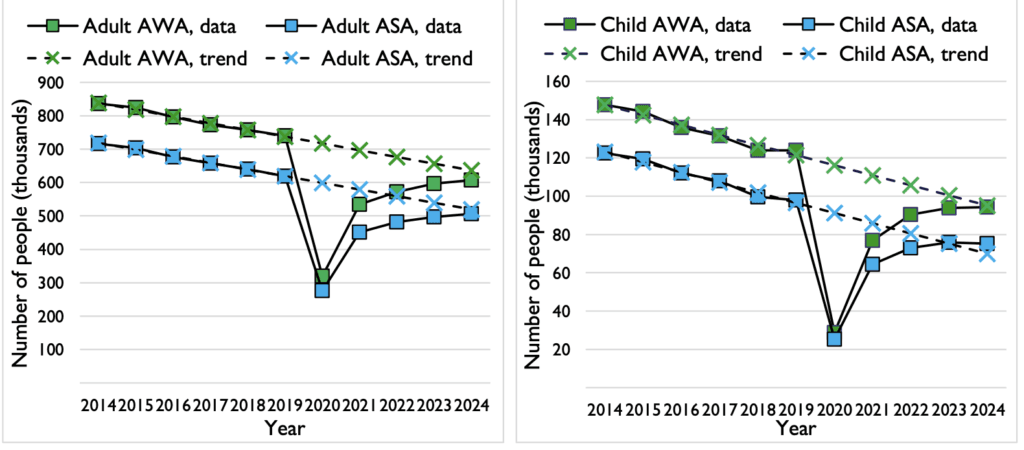
Ken has added in a straight-line projection, since a straight line fits the pre-COVID rate of decline statistically (and there are good reasons why this should be the case).
There are two things to notice here. First, and most obviously, the recent growth in numbers has not yet take us back to the anticipated decline over the intervening five years. Just pause to take that in: we are still not yet back to the level of decline that we were experiencing before COVID. Despite everything, we have not reversed the trend of decline overall as a national church.
Secondly, the shape of the curve is telling. If the increase in numbers over the last four years indicated a change in trend, then we would see the line straightening up, preparing to cross the trend line. As it is, the curve is convex; the recovery from the COVID drop is a recovery to decline, not a recovery to growth. This needs to temper our public communication, and it needs to be given due attention in the places that matter. I have asked that we spend time on this at our next meeting of Archbishops’ Council (and my last) in December. Now that they will not be giving six hours or more to discussing LLF in their meetings, I hope the House of Bishops will spend time reflecting on this.
I should at this point address the common objection to focussing on numbers. Number are people, and if there are lower numbers attending our churches, then the obvious inference is that fewer people are hearing about and responding to the good news of Jesus. I think that matters.
But numbers have institutional implications too. With fewer people attending, finances will be under pressure, and structures will need to change. I am not clear that the Church as a whole has even begun facing up to that.
There are other issues in the details of the report which are worth highlighting. For me, three things stand out: differential growth; age and demographics; and children.
Because the headline figures are aggregated, it takes some work to understand what is happening on the ground. And there are huge disparities between churches, between areas, and between churches. This applies both to the net changes from 2019 to 2024, but also year on year from 2023 to 2024.
At a diocesan level, recovery varies hugely. I took the diocesan details on Average Sunday Attendance (one of the most robust figures), and looked at percentage changes from 2019 to 2024. Here are the top and bottom eight of that table, arranged by percentage decline:
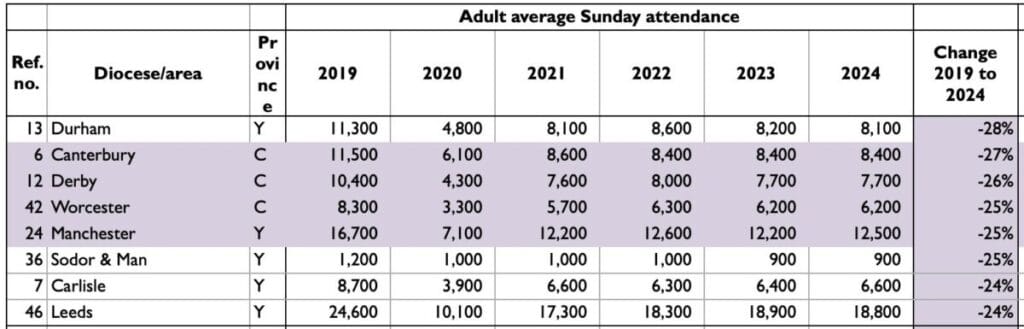
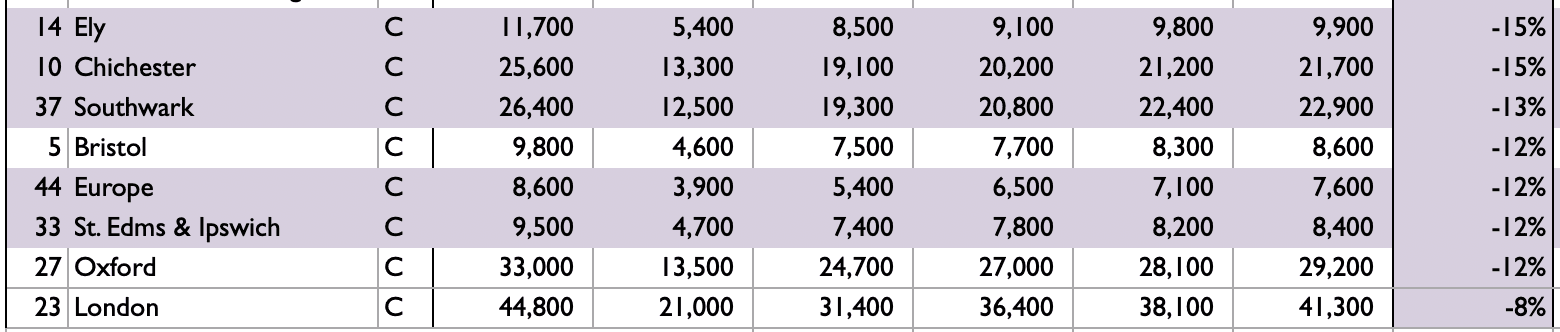
The average figure for the whole C of E over that time is -18%; the trend is 3% decline per annum. All the bottom eight would have broken above the decline trend line.
It is hard to see what has made the difference between the top and the bottom; it is certain to be a combination of leadership, strategic, demographics, and context, particularly rural versus urban. More of the most declining diocese are rural, and more of the least declining have major urban centres. London is clearly something of an outlier. David Keen, who has often commented astutely on the statistics, notes:
Interesting to see that 40% of the growth in adult attendance comes from London Diocese alone. Otherwise the growth is quite well spread across the country, with only 10 Dioceses showing a decline (with clusters in the SW and NW).
The strongest post-covid growth (2021-24) has been in big cities—London, Birmingham, Coventry, Southwark, Sheffield and Bristol are 6 of the 7 dioceses with a 20%+growth in adult attendance (St Eds and Ipswich is the other). Most of those with a lower recovery are rural, though Manchester and Derby have the 2 smallest growth figures.
Mads Davies, very quick off the mark in the Church Times, notes from the report:
A breakdown of the data by diocese indicates a high level of variation. On average, the worshipping community fell by nine per cent. But, while Canterbury and Derby reported a decline of 19 per cent and Salisbury a decline of 22 per cent between 2019 and 2024, Bristol recorded a fall of just 0.5 per cent, and London and Worcester both reported slightly higher numbers than before.
London’s AWA fell by 17 per cent in that period, and Worcester’s by 40 per cent. Liverpool reported that its worshipping community had exceeded 2019 figures in 2023, followed by a slight dip in 2024, but its AWA has fallen by 21 per cent since 2019.
And on individual churches:
For one in ten churches (12 per cent), the usual Sunday attendance, average Sunday attendance, and AWA were all higher in 2024 than in 2019. But in almost half (48 per cent), the numbers were lower across all measures.
This continues the trend that I have noted before—that middle size churches are generally disappearing, and that the C of E is turning into a combination of a few larger churches, and a large number of very much smaller churches. (An indicator of that is the growing different in the tables between the median and the mean.) The obvious question here is to ask: what are the 12 per cent doing right that the 48 per cent can learn from?
I would also want to slightly challenge Ken’s comments (from p 19) on the Quiet Revival. He notes that there are few signs of that happening in the C of E, and that leads him to be sceptical about its findings.
My observation would be: I think the 12 per cent are seeing signs of this. There are certainly signs of young people, especially young men, with no church background coming to explore faith. I see this in my own church and others that I have visited. But this is, in the main, bypassing many Church of England churches, as these numbers show, and we need to ask why that is.
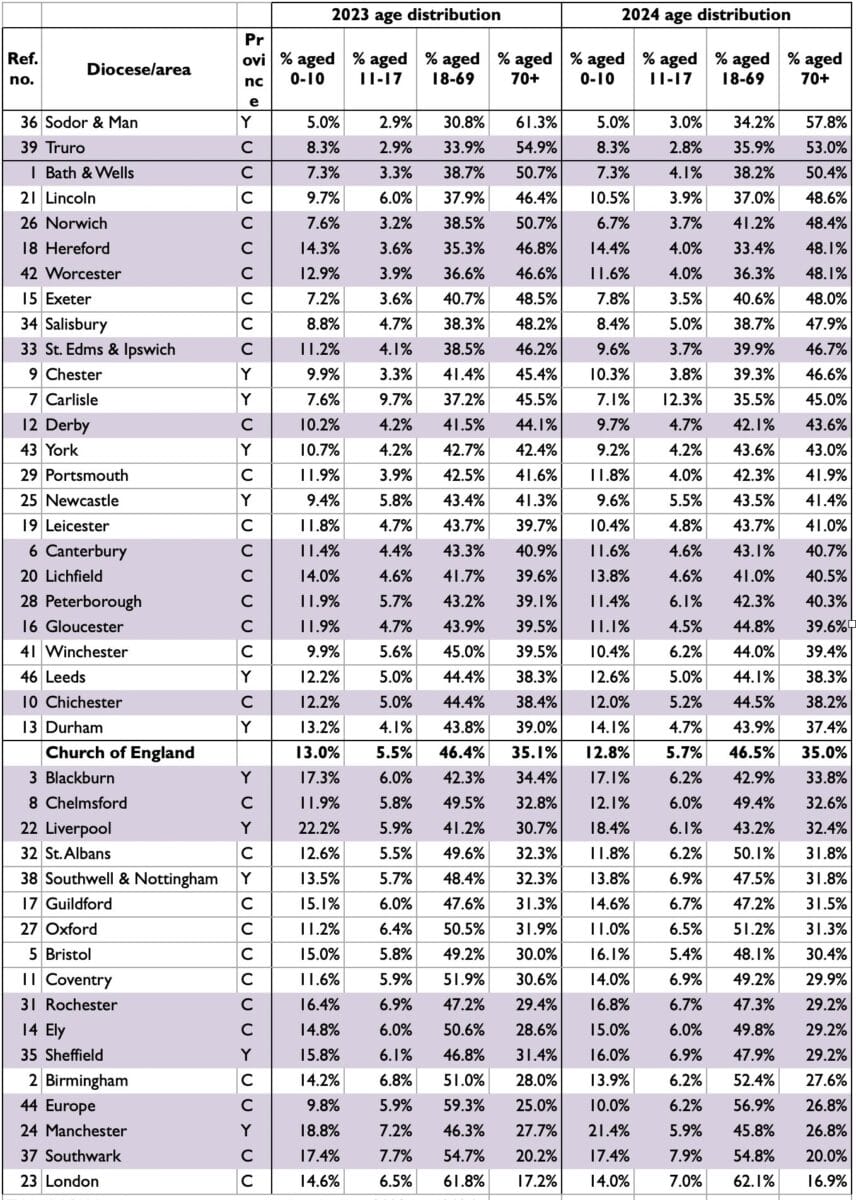
This all relates to the second issue, that of demographics and age profile. One of the tables in the diocesan data gives a split between children, young people, adults, and those over 70. (Would it help to have a more detailed breakdown? The different in life stage and experience between young adults, likely raising families, and older adults pre-retirement, is significant.)
I include here the age profile table, which I have sorted in order of largest number of over-70s to lowest. (If you click on it, you can see it in more detail.) Again, there is a huge disparity; again, there is quite a strong correlation with rural versus urban, with rural dioceses mostly having a much older age profile; and again, London is an outlier, with less than 17% over 70 compare with 53% in Truro.
For those dioceses at the top of this table, just project forward 15 years and think what will have happened. (It is not the case that no-one comes to faith later in life, and so might join a C of E church, but it is largely the case that people come to faith earlier in life.) What we are seeing here is the long-term impact of the demographic shape of the Church population, reflecting our failure to pass faith on to the next generation over the last 30, 40 or 50 years. That will not change overnight, and we will continue to see the impact of this over the next decades.
Mads Davies summarises:
The data also suggest wide variations in age profile, partly reflecting broader geographical demographics. In both Bath & Wells and Truro, more than half the worshipping community are over-70s; in Hereford, the figure is 48 per cent. Much higher proportions of under-18s are reported in urban areas, including Southwark and Manchester (both more than one quarter).
One small sign of hope is that the proportion of over 70s does not appear to have changed from last year, for the first time. The demographic crisis is here, and will have an impact, but for once, it is not deepening.
The third key issue is children and young people in C of E congregations. As I have noted previously, there has also been massive disparity between dioceses; some have recovered to their pre-COVID numbers, whilst other dioceses have seen their numbers halve. Diocesan strategy must be a key player here.
Overall, the numbers are stark: on average, we have as many children as we have churches, so, in theory, the average number of children per congregation is one. But of course that is not the reality; a small number of larger churches account for most of the child attendance, and vast numbers of congregations have no children at all.
Mads Davies again:
While child attendance in 2024 was close to or above the projected pre-pandemic trend, this reflects the previous steep decline in this measure. One third of churches had an AWA of no under-16s in 2024, compared with one quarter of churches in 2019. In 2024, 32 per cent of churches had no children in their worshipping community, compared with 26 per cent of churches in 2019. Churches’ ministry teams were also less likely to have led acts of worship in schools in 2024 than in 2019…
The data suggest that children’s attendance now tends to be concentrated in the largest churches. In 2024, the ten per cent of churches with the largest child AWA contributed 59 per cent of all child AWA, compared with 53 per cent in 2019. In this period, the number of churches with an AWA of 25 or more under-16s fell from 1270 to 850.
(I have just realised that this analysis was included by Ken as a result of a conversation I had with him a few weeks ago.)
This is a serious challenge to the C of E as a whole. It is the fruit of failing to pass on faith over the last generation or two, and it cannot easily be fixed. In those dioceses and churches with a high age profile, you cannot simply add children in; work with children cannot be detached from engagement with their parents, which is why it would be useful to have a more detailed breakdown of the adult age profile.
Finally, we need to stand back and look at how all this works out across the Church as a whole. This table, on average attendance, is startling:
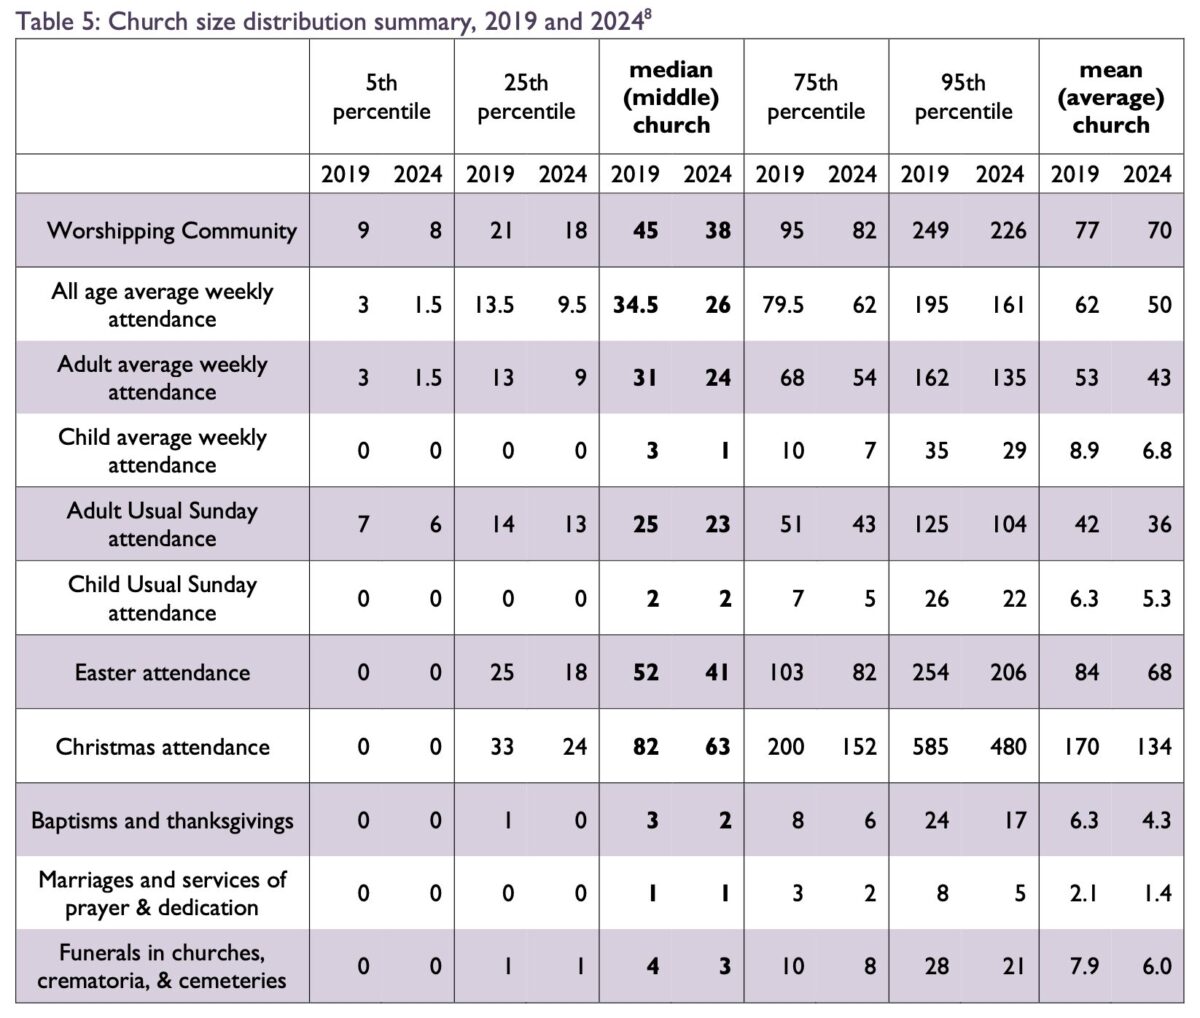
The middle column tells you that this is not a sustainable pattern for a national church. You cannot realistically maintain an expensive ancient building for a congregation of 23. It is more than ironic that, last week, Stephen Cottrell was speaking at a conference committed to preserving Church of England buildings. I could not spot any connection made there with this reality.
David Keen has commented to me about what this means:
I’m tempted to map that in some kind of organisational chart, e.g
5th percentile – usa 6 – house group
25th percentile – usa 13 – 2 house groups, maybe use community premises to gather.
median – usa 23 – hire community premises, or if largest in a group have a church building and be the ‘minster church’ for your benefice
75th percentile – usa 43 – can probably sustain a church building, but needs at least 1 other church the same size to sustain a full time leader.
95th percentile – usa 104 – the only level at which it would make financial and organisational sense to have your own building and a full time dedicated vicar.
Only the top 25% of churches have anything like a viable number of children, though I imagine most of the paid youth and childrens workers are in the top 5%, discipling the existing children, rather than in the other 95%, reaching young people with the gospel who aren’t part of the church.
The reduction in occasional offices per church means both a reduction in the fringe, and also in clergy workload—losing 2 funerals, 1 wedding and 2 baptisms a year for me would be the equivalent of 35 hours. However as clergy numbers are also declining, and compliance requirements are rising, it may not actually free up clergy time.
Someone somewhere needs to do the maths on what size congregation makes for a viable church, especially with all the roles required by charity law, by the increasing compliance and reporting burden from the CofE, the time/energy/money required to maintain a church building and pay for your share of a vicar. The growth last year was pretty low, I wouldn’t be surprised if its fizzling out in many places because we have such a hefty system to maintain and all our energy goes into that.
As I have mentioned before, these figures overall are a stark challenge to our messaging, and what we spend our time and energy engaged in. The LLF process has been a divisive disaster, and in some cases has contributed directly to our continued decline. It must stop.
And our overall messaging still needs to change. Daniel French puts it starkly:
log jam (new believers not choosing @churchofengland ) can be fixed sooner if a fraction 1% of hierarchy spoke more in the vibe of @jordanbpeterson than @owenjonesjourno .
Don’t be supernaturally shy also.
Stop sneering at Right-coded seekers!
They hear you loud n clear https://t.co/3twlV08jrm— Rev Daniel French (@holydisrupter) October 28, 2025
So, there are many challenges in these statistics, and these are my first reflections on the details. Do please make your own observations, and I might come back and add some of them in to the body of the article.
 Buy me a Coffee


The sad detail is that you are approaching your last Archbishops’ Council. Your incisiveness is sorely needed. Every good wish.
Thank you.
Good piece Ian, as ever. Should the second ‘might’ in the paragraph beginning ‘For those dioceses at the top of this table…’ be ‘while’?
Probably!
Actually it was a mistyped ‘but’ which got autocorrected…
Are there any figures, a demographic breakdown on regular financial giving.
Is that not an important measure in spiritual health and maturity, growth?
For me the most disappointing statistic is the decline of children in the top 95% of churches – which looks like it is in-line with all the other declines. I have a bunch of optimistic takes “We shouldn’t be mourning that there was a revival in the fifties and those saints are going to glory”, “most children are in churches where there are plenty of children and peers”*, “look – we are growing younger!” that are all dashed to pieces by the reality of that decline.
(*At the risk of being a non-Anglican supporter of the gathered church, I would much rather one church with thirty children than fifteen with two.)
And surely the answer to our ancient and historic heritage has to be: The worshipping congregation can’t be the ones who fund it.
What stands out for me is that we have three groups of churches: 12% growing, 48% declining, and 40% remaining stable. Because the differences between these groups are so marked, the overall averages tell us little of strategic value. What we really need is to see the data broken down by these groups; that would help us understand how to foster renewal from within and identify our key opportunities and greatest challenges.
Yes, I would agree with you there. Ken Eames has the raw data. I think the key questions about each of these groups are:
a. what size are they
b. what is their vision
c. are they urban or rural?
You might have others.
Thanks Ian, very interesting – in our free church we tend towards growth over a period of years until we have too many for our accommodation and then we do a church plant allowing us to start growing again.
Is there anything like this in the CofE?
Yes, it is a very big thing amongst some churches!